Brazil Key Figures
- Population:
- 215 million
- GDP growth rate:
- 2.90 %/year
- Energy independence:
- 100%
Data of the last year available: 2022
- Total consumption/GDP:*
- 100 (2005=100)
- CO2 Emissions:
- 1.95 tCO2/capita
- Rate of T&D power losses:
- 15.2%
* at purchasing power parity
View all macro and energy indicators in the Brazil energy report
Brazil Related News
View all news, archive your new and create your own daily newsletters only on your topics/countries of interest with Key Energy Intelligence
Brazil Related Research
Benefit from up to 2 000 up-to-date data series for 186 countries in Global Energy & CO2 data
A data overview is available in the global energy statistics app
Total Energy Consumption
With a per capita consumption of 1.4 toe (2022), Brazil is within the average range for semi-industrialised countries but well below the European average of 2.9 toe.
Total energy consumption increased by 0.5% in 2022 to 302 Mtoe, following a 4.2% rebound in 2021 after a 2% reduction in 2020. It remained roughly stable between 2016 and 2019, and increased at a fairly rapid pace between 2000 and 2014 (3.5%/year).
Interactive Chart Brazil Total Energy Consumption
Benefit from up to 2 000 up-to-date data series for 186 countries in Global Energy & CO2 data
View the detailed fondamentals of the market at country level (graphs, tables, analysis) in the Brazil energy report
Crude Oil Production
The country's oil production has been growing at the rapid pace of 4.4%/year since 2013, reaching 157 Mt in 2022 (76% of which comes from the pre-salt). Over the first three quarters of 2023, production increased by 11%.
The country is a net exporter of crude oil (net exports of 56 Mt in 2022); crude oil exports increased by around 20%/year between 2013 and 2020, reaching 69 Mt in 2020. They decreased by 2.9% in 2021 and increased by 1.7% in 2022.
Interactive Chart Brazil Crude Oil Production
Benefit from up to 2 000 up-to-date data series for 186 countries in Global Energy & CO2 data
Additionally, for more detailed information on refineries, you can request a sample of our America Refineries Dataset
Oil Products Consumption
Oil product consumption rose by 3% in 2022 to 107 Mt, after a 9% rebound in 2021. It had increased significantly between 2003 and 2014 (+3.5%/year, on average), then decreased by 4%/year between 2014 and 2020.
Graph: OIL CONSUMPTION (Mt)
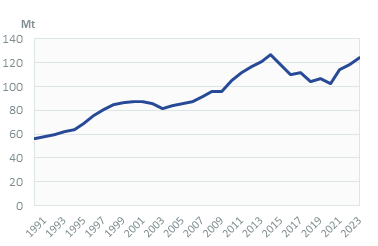
The transport sector is the main oil consumer (62% of consumption), followed by non-energy uses (13%), the residential-services sector (12%), industry energy uses (9%), the hydrocarbon industry, and power plants (2% each).
Interactive Chart Brazil Refined Oil Products Production
Benefit from up to 2 000 up-to-date data series for 186 countries in Global Energy & CO2 data
Additionally, for more detailed information on refineries, you can request a sample of our America Refineries Dataset
Natural Gas Consumption
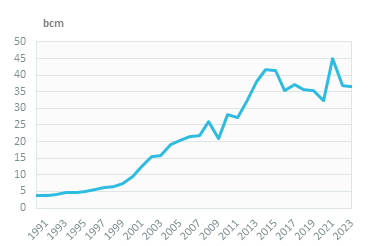
Gas demand dropped by 24% in 2022 to 33 bcm due to lower needs for electricity production (gas was used to substitute weaker hydroelectricity production in 2021 due to major droughts) and higher prices. It decreased by 20% to 34.5 bcm between 2014 and 2020. It rose at the strong pace of 12%/year between 1999 and 2014, mainly due to the power sector and, to a lesser extent, industry.
Graph: NATURAL GAS CONSUMPTION (bcm)
Interactive Chart Brazil Natural Gas Domestic Consumption
Benefit from up to 2 000 up-to-date data series for 186 countries in Global Energy & CO2 data
Additionally, for more detailed information on the LNG trade, you can request a sample of our America LNG Trade Dataset
Coal Consumption
Coal consumption decreased by 18% in 2022, reaching 23.4 Mt. It peaked at around 29 Mt in 2021 due to the higher use of coal power plants to substitute weak hydro production. Over the last few years, the trend in coal consumption has been decreasing (-5%/year from 2015 to 2020).
Graph: COAL CONSUMPTION (Mt)
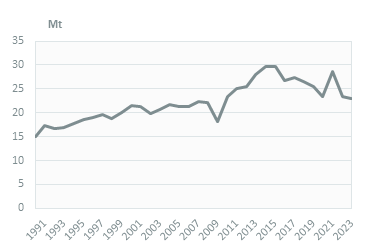
Industry accounts for 71% of demand, while the remainder is used to produce electricity.
Graph: COAL CONSUMPTION BREAKDOWN BY SECTOR (2022, %)
Interactive Chart Brazil Coal and Lignite Domestic Consumption
Benefit from up to 2 000 up-to-date data series for 186 countries in Global Energy & CO2 data
View the detailed consumption trends at country level (graphs, tables, analysis) in the Brazil energy report
Power Consumption
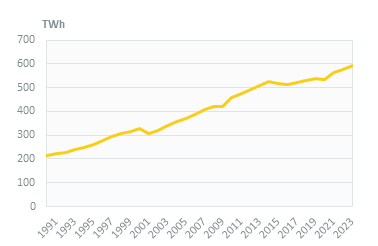
Electricity consumption increased by around 1.5%/year between 2015 and 2022 to 580 TWh, after increasing rapidly between 2001 and 2015 (around 3.7%/year). Almost all households are electrified (99.5% in 2022).
Graph: ELECTRICITY CONSUMPTION (TWh)
Renewable in % Electricity Production
The 10-Year Energy Expansion Plan 2031 (Plano Decenal de Expansão de Energia 2031, PDE 2031) forecasts a 48% share of renewables in the energy mix in 2031.
Since 2009, new contracts for wind, biomass and small hydro plant projects are awarded through competitive bidding.
Interactive Chart Brazil Share of Renewables in Electricity Production (incl hydro)
Benefit from up to 2 000 up-to-date data series for 186 countries in Global Energy & CO2 data
CO2 Fuel Combustion/CO2 Emissions
In a second update of its NDC (October 2023), Brazil set more ambitious targets, with a 49% cut in GHG emissions by 2025 and 53% by 2030, compared to 2005 levels, The objective is to reach carbon neutrality by 2050.
Total GHG emissions increased by 3.5%/year from 2010 to 2021 and fell by 8% in 2022 to 2.32 GtCO2eq, mainly due to a drop in land-use change emissions (-15%). In 2022, land use was responsible for 48% of the total, followed by farming activities (and animal production) at 27%, the energy sector (18%), waste (4%), and industrial processes (3%).